Asking Prices Fall for the First Time Since March: What Redfin's Numbers Mean for Fall Buyers
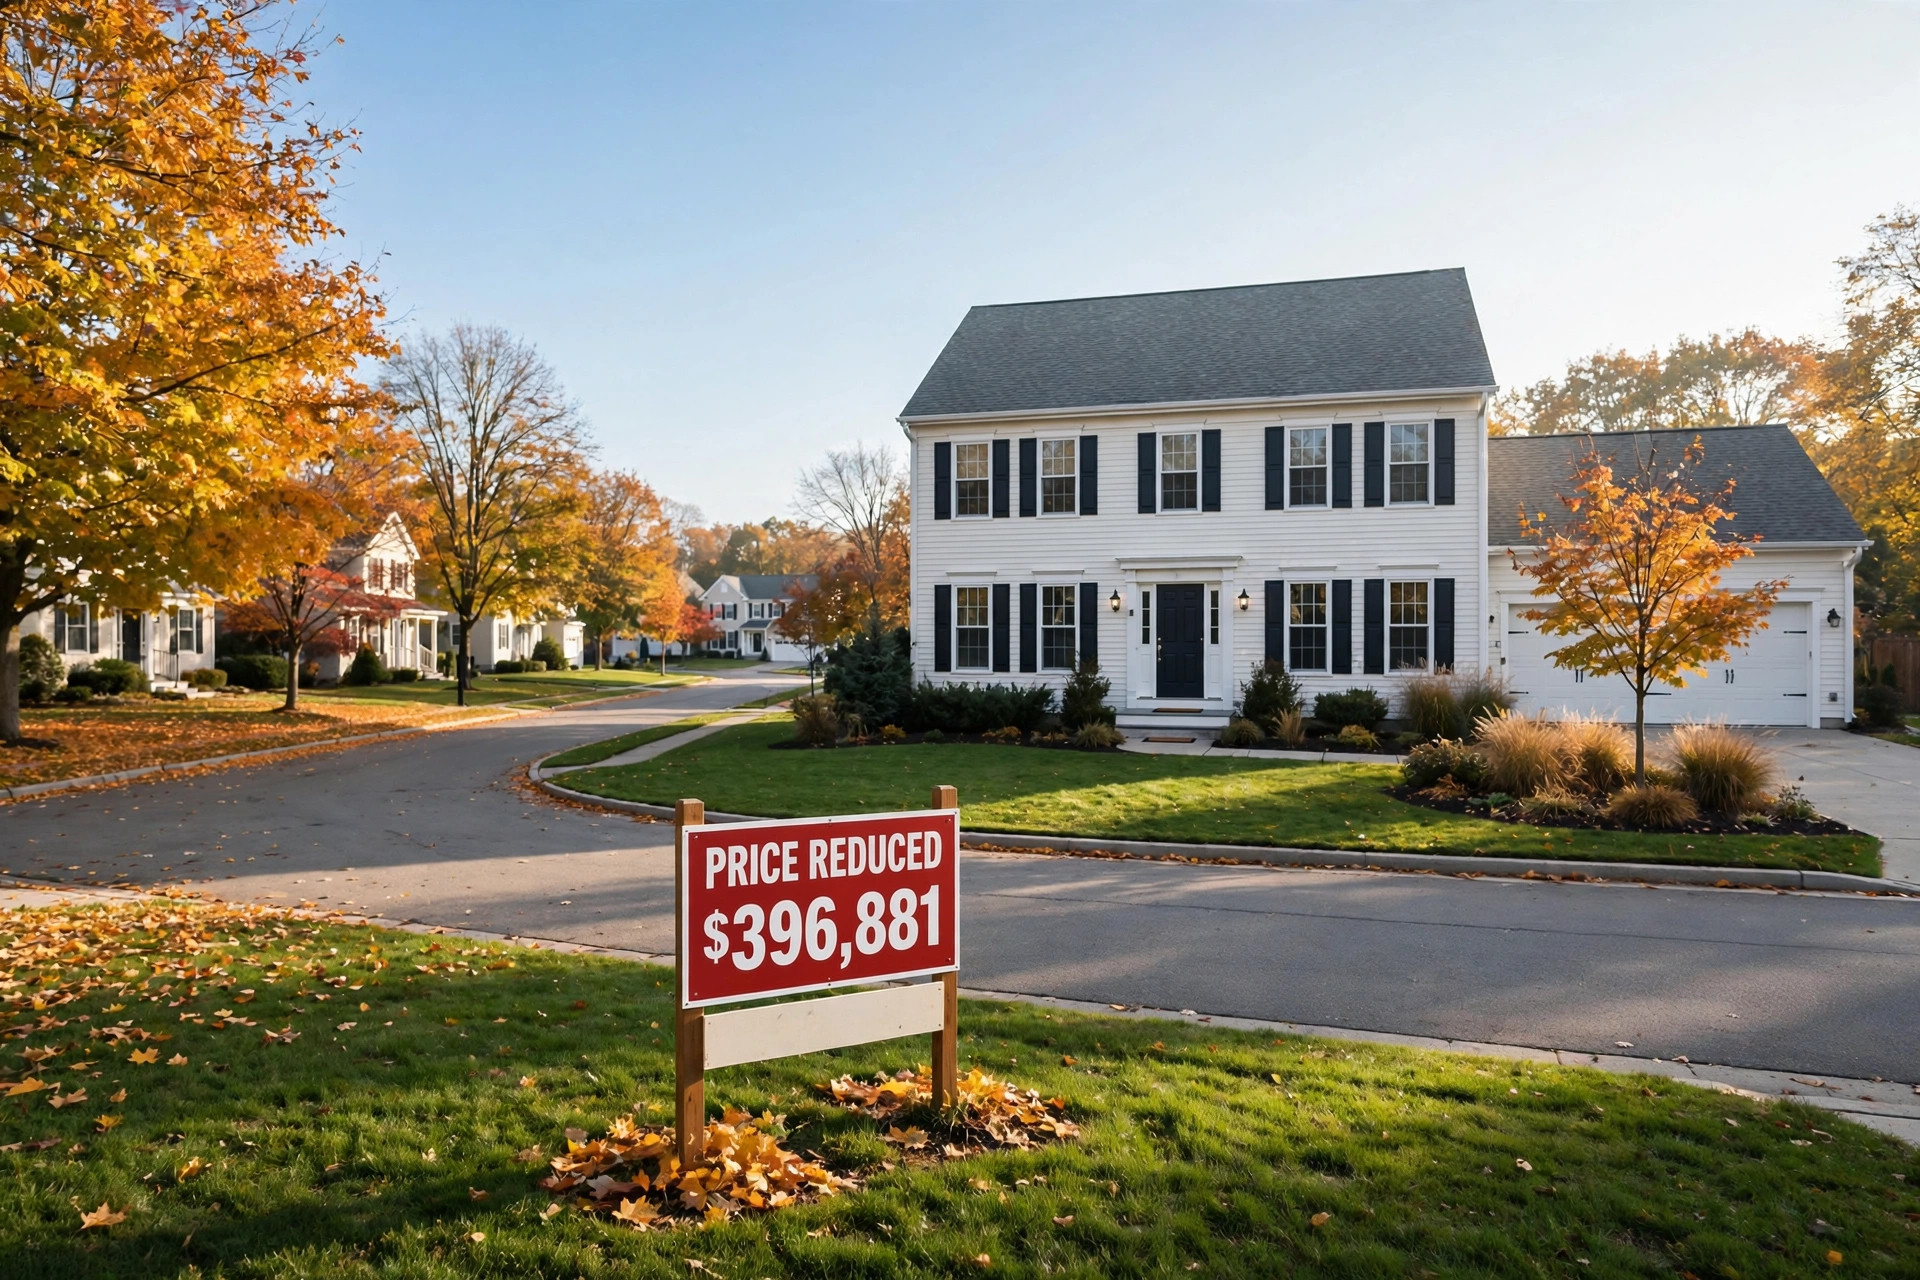
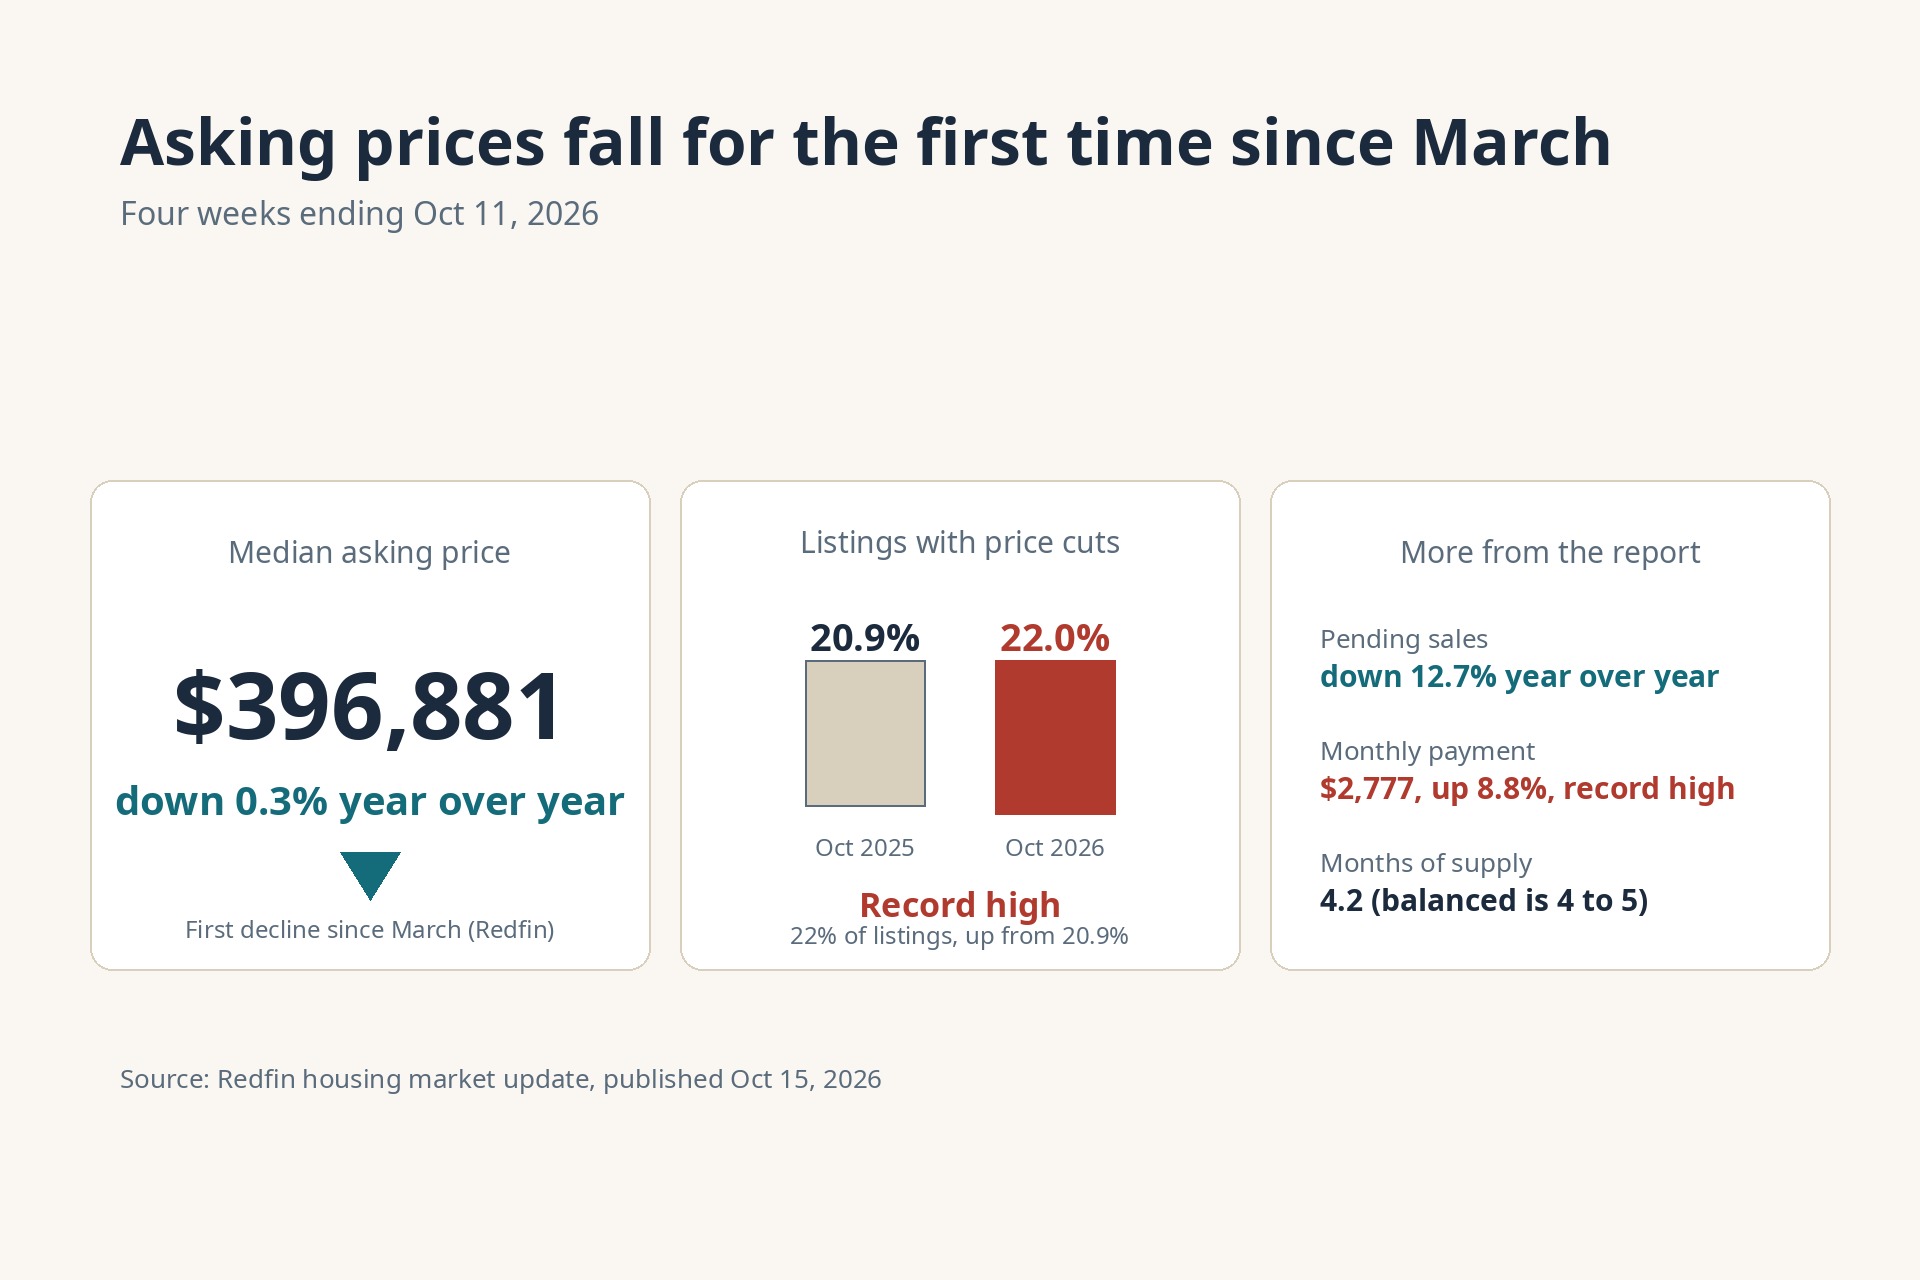
The median US asking price fell 0.3% year over year to $396,881 in the four weeks ending October 11, the first decline Redfin has recorded since March. At the same time, 22% of sellers with active listings cut their asking price, the highest share in Redfin's records, up from 20.9% a year earlier. Those two numbers tell the story of this fall market in a sentence: buyers face the most expensive financing on record, and sellers are finally blinking.
The data comes from Redfin's weekly housing market update, published October 15 and covering the four weeks ending October 11, 2026, drawn from more than 900 US metro areas. Weekly figures can be revised, and the next weekly update is expected around October 22, so treat these numbers as a snapshot of where the market stood in early to mid-October, not a forecast of where it is heading.
What Redfin found: asking prices down, sale prices barely up
The two headline price numbers moved in opposite directions, and the gap between them matters.
The median asking price (seasonally adjusted) landed at $396,881, down 0.3% from a year earlier. Redfin's own note on the figure: first decline since March. Sellers are trimming what they ask, and after months of holding firm, the national number finally cracked.
The median sale price told a softer story. It came in at $391,116, up 0.5% year over year. Redfin flagged it as the slowest price growth since March. Sale prices are what buyers actually pay, and they have not fallen nationally, but the pace of growth has nearly stalled. Redfin's take: "Home prices are losing momentum," and "some relief could be on the horizon for buyers." That is Redfin's interpretation of its own data, not an independent forecast, and it is worth quoting exactly because it is the source's own reading.
For context on the financing side, our coverage of the rate climb is here: mortgage rates hit 7.50% after hot September inflation, and Freddie Mac's 7.40% weekly reading.
The payment record: $2,777 a month
The figure that may matter most to buyers is the median monthly mortgage payment. Redfin puts it at $2,777 a month at a 7.4% mortgage rate, up 8.8% from a year earlier and, in Redfin's words, the highest level in its records except the prior week.
A note of caution, and one we take seriously: Redfin does not disclose how it computes this payment, and standard mortgage math does not reproduce it from the published assumptions, so quote $2,777 strictly as Redfin's published estimate. The year-ago figure implied by the 8.8% increase is about $2,552, so the typical payment has climbed roughly in line with that increase in just twelve months.
The rate backdrop inside the release matches what we have reported: the weekly average mortgage rate hit a three-year high of 7.4% in the week of October 8, while the daily average eased slightly in recent days, dipping to 7.45% on October 14 from 7.61% about a week earlier.
22% of sellers are cutting prices, a record high
Price cuts are the clearest signal that sellers are adjusting to this market. Twenty-two percent of listings had a price cut during the four-week window, up from 20.9% a year earlier, and Redfin says that is the highest share it has ever recorded. That is a 1.1 percentage point increase, about 5.3% higher in relative terms.
A few related signals from the same table are worth noting. The share of homes selling above list price ticked up to 23.6% from 23.2%, and the average sale-to-list ratio held essentially flat at 98.4% versus 98.3%. The share of homes going off the market within two weeks slipped to 29% from 29.6%, and the median days on market rose by one to 49. Read together: competition has not collapsed, but listings are sitting a little longer, and more sellers are negotiating with themselves before buyers do it for them.
Pending sales fell in all 50 of the largest metros
This is the broadest signal in the release. Pending sales totaled 286,531 (seasonally adjusted), down 12.7% year over year though up 1.5% from the prior week. Redfin calls it the lowest level in its records except the prior week, and near the lowest in records dating back to 2021, including the end of 2023, when mortgage rates were nearing 8%.
The geographic spread is what makes it stand out: pending sales declined year over year in all 50 of the most populous US metro areas, which Redfin says has not happened in the table it analyzes for three years. The steepest declines were Seattle (down 26%), Atlanta (down 22.7%), San Diego (down 22.6%), Denver (down 19.3%), and Minneapolis (down 18.5%).
On sale prices by metro, the spread was wide. San Francisco led increases at 18.1%, followed by Detroit (9.4%), West Palm Beach, FL (7.8%), Chicago (5.2%), and Newark, NJ (5.1%). The biggest declines were Seattle (down 6.3%), San Jose, CA (down 4.8%), Orlando, FL (down 3.4%), Charlotte, NC (down 2.3%), and Anaheim, CA (down 2.1%). Seattle appears on both extremes lists: the weakest demand and one of the weakest price outcomes in the country.
The supply picture: 4.2 months, 49 days
Months of supply rose to 4.2 from 3.8 a year earlier. Redfin notes that 4 to 5 months of supply is considered balanced, which puts the national market at the doorstep of balance after years of running lean.
The inventory numbers behind that: active listings (seasonally adjusted) were 1,506,396, up 2% year over year and 0.8% from the prior week, while new listings came in at 359,859, down 1.3% year over year but up 0.4% from the week before. So the supply buildup is coming from homes sitting longer, not from a flood of new listings. That matches the 49-day median time on market, one day longer than a year ago.
What this means for buyers this fall
Put it together and the fall window is real, but it is a window with a price of admission. Asking prices have dipped, a record share of sellers are cutting, supply is approaching balance, and sales activity is weak nearly everywhere. That is negotiating leverage, especially for buyers who can transact now and are not rate shopping against the same small pool as spring buyers.
The other side is the payment. At a record $2,777 estimated median payment, the monthly cost of buying has risen far faster than prices have fallen. A 0.3% dip in asking prices is real, but it does not offset an 8.8% rise in the payment. This is the tradeoff of the fall 2026 market: softer prices, harder financing.
If buying looks painful on the monthly math, renting is worth a serious look in many markets: our October coverage found landlords ramping up concessions as rents rebounded. Compare the two honestly before you stretch.

Frequently Asked Questions
Did US asking prices really fall?
Yes, for the first time since March, according to Redfin. The median asking price (seasonally adjusted) fell 0.3% year over year to $396,881 in the four weeks ending October 11, 2026. Redfin describes it as the first decline since March. Sale prices have not fallen nationally, they rose 0.5% to $391,116, but that was the slowest growth since March.
What is the typical monthly mortgage payment right now?
Redfin's published estimate is $2,777 a month at a 7.4% mortgage rate, up 8.8% from a year earlier and the highest level in Redfin's records except the prior week. Redfin does not disclose its payment methodology, so treat the figure as Redfin's estimate rather than a number you can recompute.
How many sellers are cutting prices?
Twenty-two percent of sellers with active listings cut their asking price during the four weeks ending October 11, up from 20.9% a year earlier. Redfin says that is the highest share in its records.
Are pending sales falling everywhere?
Redfin says pending sales declined year over year in all 50 of the most populous US metro areas, which it notes is the first time that has happened in three years. Nationally, pending sales totaled 286,531, down 12.7% from a year earlier but up 1.5% from the prior week.
Is it a good time to buy a home this fall?
The data gives buyers more leverage than they have had in a while: asking prices dipping, record price-cut share, supply approaching the balanced range at 4.2 months, and weak pending sales in every major metro. The counterweight is financing, with the median payment at a record $2,777. This is a snapshot from the four weeks ending October 11, not a forecast, and the next weekly Redfin update is expected around October 22. Nothing here is financial advice.
Will prices keep falling?
This release does not say. It is a weekly snapshot covering the four weeks ending October 11, and Redfin does not predict future prices in it. The trend lines to watch in the next release are whether the asking-price decline repeats, whether the price-cut share keeps climbing past 22%, and whether pending sales recover from near-record lows.
This article summarizes Redfin's weekly housing market update published October 15, 2026, covering the four weeks ending October 11, 2026. Weekly figures are subject to revision. Nothing here is financial advice.