More Homes for Sale, Lower Asking Prices: Realtor.com Weekly Data for October 17
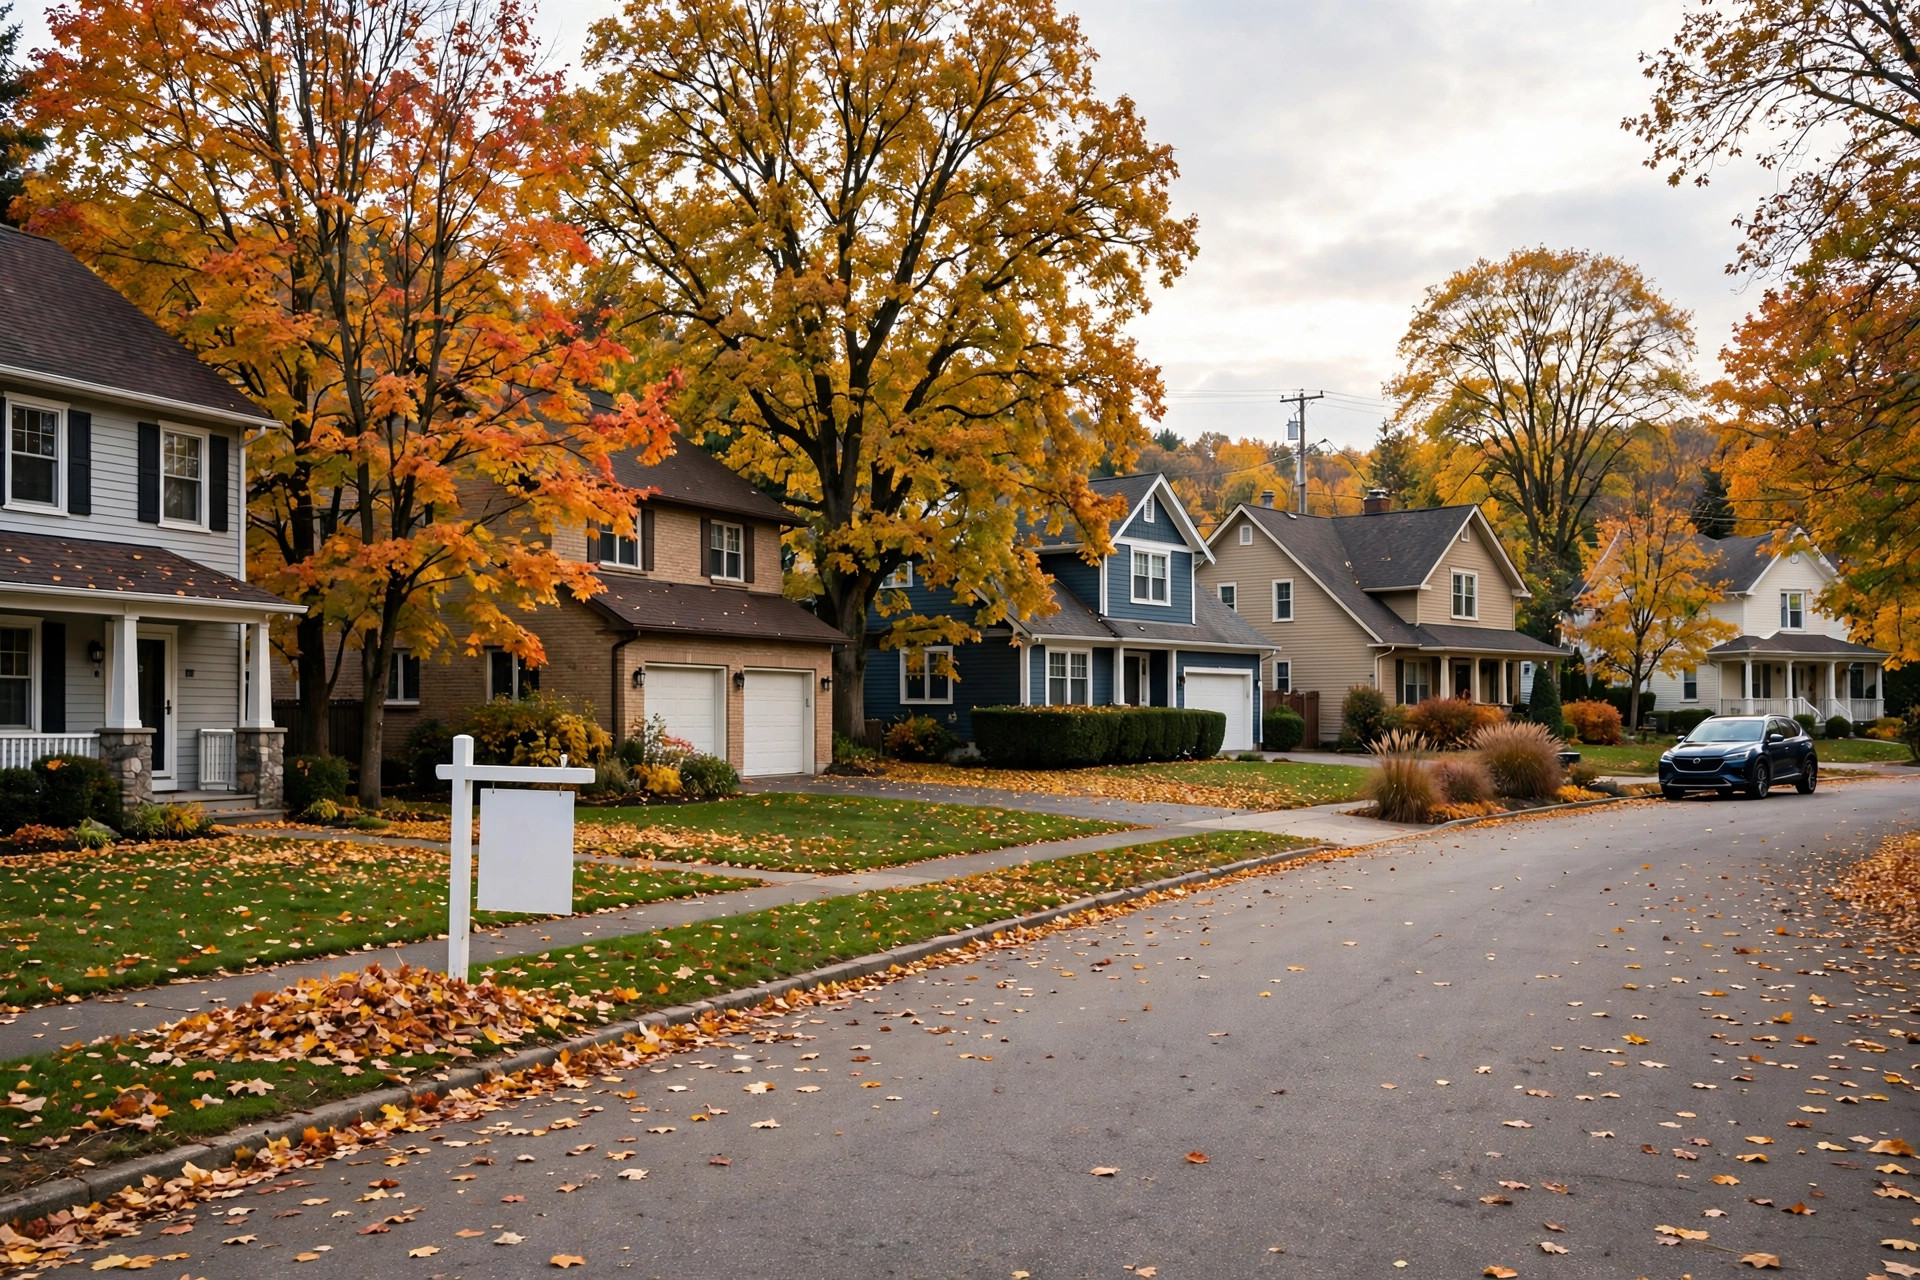
Buyers finally have more choice, and sellers are feeling it in asking prices. Realtor.com's Weekly Housing Trends update for the week ending October 17, 2026, shows active inventory up 7.7% from a year ago, the fastest weekly growth rate since late January, while the median listing price fell 2.1% from the same week last year to $415,000.
The important detail is why inventory is growing. It is not a flood of new sellers. Instead, the seasonal slowdown in buyer activity is letting unsold listings pile up, pushing the total count higher. Inventory growth has built all fall, from roughly 4% year over year growth in late August to nearly 8% now. Year to date, active inventory is up 4.7%.
Asking prices keep sliding
The median listing price held steady week to week at $415,000, down 2.1% from the same week last year, according to Realtor.com. Listing prices have now fallen by 2% or more in all three weeks ending in October, and they have been negative on a year over year basis for 40 consecutive weeks. Year to date, median listing prices sit 2.0% below 2025 levels.
The median price per square foot also declined, falling 1.4% year over year.
That context matters. The same Realtor.com update cites a 7.40% average mortgage rate on the market at the time of writing, and notes that September pending home sales were the lowest in data history, down 7.3% month over month and 11.3% year over year. Our coverage of September pending home sales and the Freddie Mac rate drop to 7.32% fills in both halves of that picture.
Homes are not sitting much longer, though
Here is the twist. Homes are not taking longer to sell. Median days on market came in at 62 days, holding even with the corresponding week last year. Homes have now sold at the same pace or faster than a year ago for 21 consecutive weeks, a streak that began in late May. Year to date, time on market remains 2 days slower than 2025.
In other words, the market is not frozen. Well priced homes still move at about last year's pace. What has changed is the supply side: more homes are listed, fewer are being absorbed quickly enough to stop the count from climbing.
New listings are still falling
New listings, which Realtor.com describes as a measure of sellers putting homes up for sale, fell 5.1% year over year. The three weeks ending in October have all seen new listings slip by 4% or more. Year to date, the change in new listings is -0.3%.
What this means for buyers and sellers
For buyers, the message is straightforward: there is more to choose from, and asking prices are lower than a year ago. Inventory is higher and asking prices are lower than a year ago. It does not mean bargains everywhere. With mortgage rates near 7.4%, the monthly payment still decides what most buyers can actually afford, and homes priced for the market are still selling at last year's pace.
For sellers, the message is equally clear: pricing to the market matters more than ever. With inventory climbing because unsold listings accumulate, an overpriced listing now competes against a growing shelf of alternatives. Our coverage of the widest seller surplus since 2013 tells the same story from the other side of the market.
Realtor.com publishes a new Weekly Housing Trends update each Thursday, so next week's print will show whether inventory growth keeps accelerating toward 8% or levels off as the fall season deepens.
Frequently Asked Questions
How much did active inventory rise in the week ending October 17, 2026?
Active inventory rose 7.7% compared to a year ago, the highest weekly growth rate since late January, according to Realtor.com.
What was the median listing price in the week ending October 17, 2026?
The median listing price was $415,000, steady week to week and down 2.1% from the same week last year, according to Realtor.com.
Did homes sell faster or slower than a year ago?
Neither. Median days on market was 62 days, holding even with the corresponding week last year, according to Realtor.com.
Why is inventory growing if new listings are falling?
Because unsold listings are accumulating. New listings fell 5.1% year over year, but the seasonal slowdown in buyer activity means homes that do not sell stay listed, pushing the total count higher, according to Realtor.com.
How long have listing prices been falling year over year?
Median listing prices have been negative on a year over year basis for 40 consecutive weeks, according to Realtor.com.