NAR Pending Home Sales Plunged 7.3% in September as Rising Mortgage Rates Kept Buyers Away
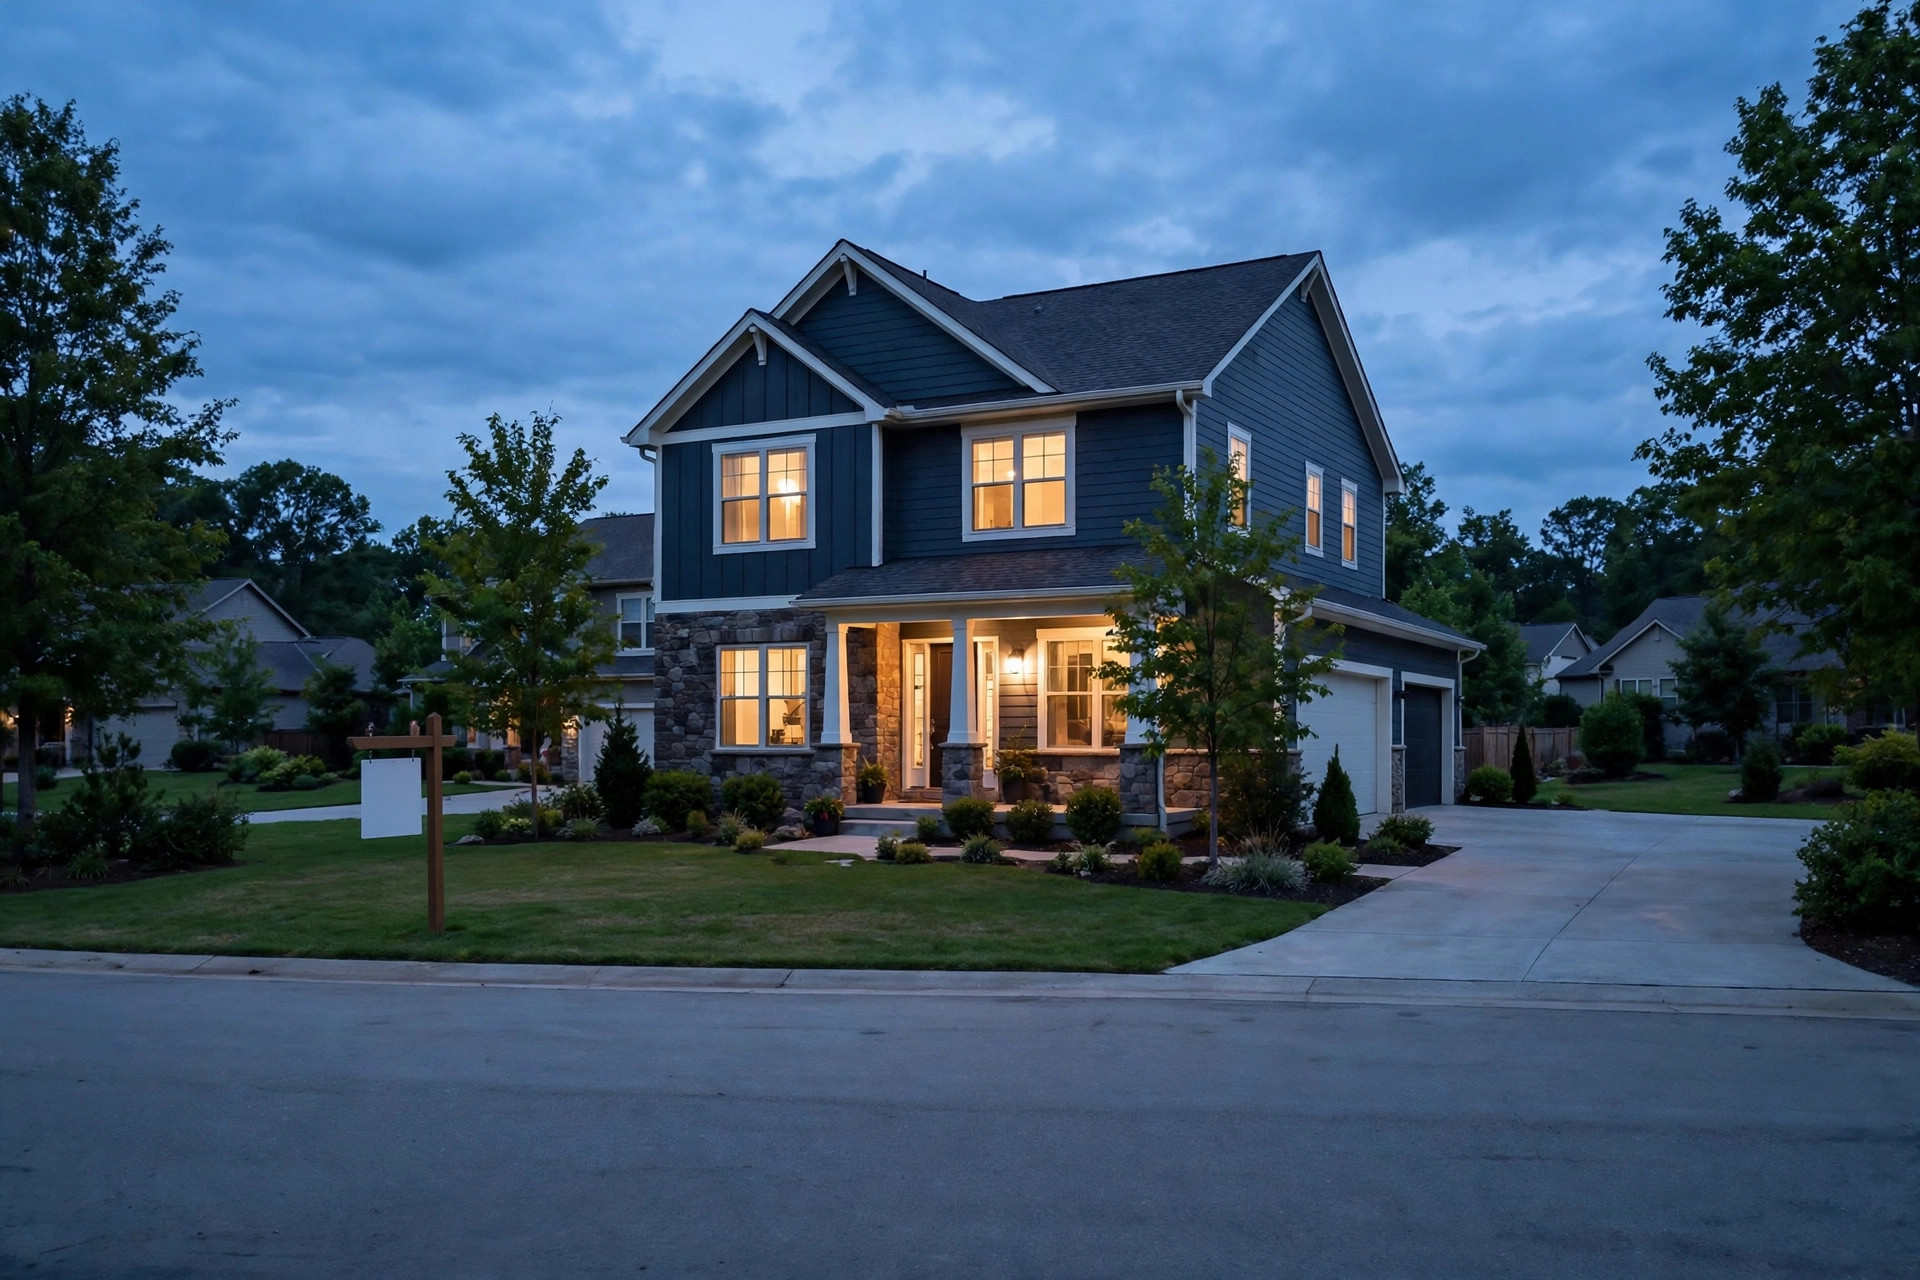
Pending home sales in the United States fell sharply in September 2026, as rising mortgage rates pushed more buyers to the sidelines. The National Association of Realtors reported on October 20 that its Pending Home Sales Index decreased 7.3% from August and 11.3% from September 2025.
"Market conditions weakened in September due to fast-rising mortgage rates," said Lawrence Yun, NAR's chief economist. "Although job growth and income gains can support home purchases, housing affordability is more affected by changes in mortgage rates."
A nationwide drop, led by the West
The decline was not concentrated in one part of the country. Pending home sales fell month over month in all four major U.S. regions, with the West posting the largest decrease, followed by the South, Midwest and Northeast. Year over year, pending sales also declined in all four regions.

Here is how each region performed:
- Northeast: down 4.2% from August, down 9.4% from a year ago
- Midwest: down 6.5% from August, down 8.7% from a year ago
- South: down 8.2% from August, down 12.0% from a year ago
- West: down 9.2% from August, down 15.0% from a year ago, the largest regional decrease
Yun suggested the rate damage may be near its peak, but with a caveat. "Given that mortgage rates have already risen much more than the Federal Reserve's short-term interest rate hikes, mortgage rates could be topping out," he said. "However, increasing energy prices and the resulting inflationary pressure are highly uncertain."
He added that prices have held up despite weak demand: "Despite the difficulty of obtaining a mortgage, the limited number of distressed properties is ensuring steady home prices." And he pointed to a possible pause in activity rather than a collapse: "Buyers and sellers may simply be holding back until mortgage rates move favorably."
Why closed sales rose while pending sales fell
One figure in the data may look confusing at first. NAR reported earlier, in a release dated October 13, that existing-home sales actually increased 1.5% month over month in September, reaching a seasonally adjusted annual rate of 3.99 million. That report also noted sales were down 2.2% year over year.
The two reports measure different moments in a home purchase. Existing-home sales count closings, which typically reflect contracts signed weeks earlier. Pending home sales count contracts signed during the month itself, making the pending sales index a more current read on buyer demand. So a September rise in closings and a September drop in new contracts are not contradictory: they describe different stages of the same pipeline.
"Despite the small monthly gain on a seasonally adjusted basis, August and September marked the two slowest months for home sales this year," Yun said in the existing-home sales release. "Further increases in mortgage rates in recent weeks mean fewer buyers can qualify to purchase a home."
The same release showed the average 30-year fixed mortgage rate was 6.86% in September, up from 6.67% in August and 6.35% one year ago, according to Freddie Mac figures cited by NAR.
Inventory is growing, but affordability is not
Total housing inventory reached 1.60 million units in September, up 1.9% from August and 4.6% from September 2025. Unsold inventory represented a 4.8-month supply, unchanged from August and up from 4.5 months one year ago. The median existing-home price for all housing types was $417,500, up 1.3% from one year ago ($412,300), marking the 39th consecutive month of year-over-year price gains.
"Higher inventory and lengthening days on market give buyers improved negotiating power," Yun said. "Home sellers need to be realistic about local market conditions, which could require price discounts and other incentives to attract buyers."
Other details from the September existing-home sales report:
- The Housing Affordability Index registered 105.4, down from 106.7 one year ago. Affordability declined year over year in three of the four regions: the Northeast was down 4.5%, the Midwest down 3.1% and the South down 0.4%, while the West rose slightly by 1.0%.
- First-time buyers represented 31% of sales, up from 30% in August and 30% one year ago.
- Cash sales accounted for 27% of transactions, unchanged from last month and down from 30% one year ago.
- The median time on market was 33 days, up from 31 days in August and unchanged from September 2025.
The broader backdrop for September was also weak on the supply side: new construction pulled back too, as covered in our report on September housing starts and permits.
Redfin's separate measure also fell
Redfin published its own September 2026 pending sales measure, and it is a separate index from NAR's, calculated with its own methodology. The two should not be read as confirming each other. On Redfin's index, U.S. pending home sales declined 4% from August in September on a seasonally adjusted basis, the biggest monthly drop in more than three years. Redfin said pending sales sat at their lowest level since spring 2014, with the exception of April 2020, when the onset of the pandemic froze the market.

Redfin also reported that 14.5% of homebuying deals that went under contract in September were canceled. That is the highest share since the start of the pandemic, and other than March and April 2020, it is the highest share on record. All figures in Redfin's September report are seasonally adjusted, except median sale price and mortgage rate data.
"It's not surprising that when rates climb above 7%, fewer people buy homes because fewer people can afford them," said Chen Zhao, Redfin's head of economic research.
Foreclosures tick higher, but stay low by historical standards
Foreclosure data from ATTOM adds one more layer of context. In August 2026, 40,277 U.S. properties had foreclosure filings, including default notices, scheduled auctions and bank repossessions. That was up 1% from the previous month and up 13% from a year ago.
Lenders repossessed 5,794 properties through completed foreclosures in August, up 22% from the previous month and 42% from a year earlier. Lenders initiated the foreclosure process on 25,894 properties, down 3% from the previous month but up 7% from a year ago. ATTOM's key takeaway: overall foreclosure activity remains below pre-pandemic norms.
"August's data shows that foreclosure activity continues to trend above year-ago levels, particularly in completed foreclosures, which saw a notable annual increase," said Rob Barber, CEO at ATTOM. "While some homeowners are still facing financial challenges, overall foreclosure volumes remain well below historical norms and the broader housing market continues to demonstrate resilience."
Frequently Asked Questions
What are pending home sales?
Pending home sales count homes where a contract has been signed but the sale has not yet closed. NAR tracks them in its Pending Home Sales Index, which is considered a forward-looking indicator because a signed contract typically becomes a closed sale within a month or two.
How much did pending home sales fall in September 2026?
NAR reported that pending home sales decreased 7.3% from August and 11.3% from September 2025. The report was released October 20, 2026.
Which region saw the biggest decline?
The West, where pending home sales fell 9.2% month over month and 15.0% year over year, the largest regional decrease. The South fell 8.2% from August and 12.0% from a year ago, the Midwest fell 6.5% and 8.7%, and the Northeast fell 4.2% and 9.4%.
Why did pending home sales fall?
NAR chief economist Lawrence Yun pointed to rising mortgage rates: "Market conditions weakened in September due to fast-rising mortgage rates." The average 30-year fixed rate was 6.86% in September, up from 6.67% in August and 6.35% one year ago, according to Freddie Mac figures cited by NAR.
How can existing-home sales rise while pending sales fall?
They measure different moments. Existing-home sales count closings, which reflect contracts signed weeks earlier. Pending sales count contracts signed during the month itself. So September's closed sales can look better while new contract signings, the more current signal of demand, are weakening.
What is the difference between NAR's pending home sales and Redfin's?
They are two separate indexes with their own methodologies, and they should not be treated as confirming each other. NAR reported a 7.3% month-over-month decline on its index. Redfin's own index showed a 4% month-over-month decline on a seasonally adjusted basis, which Redfin called the biggest monthly drop in more than three years.