Redfin: U.S. Pending Home Sales Sink to Record Low as Mid-7% Rates Freeze Buyers
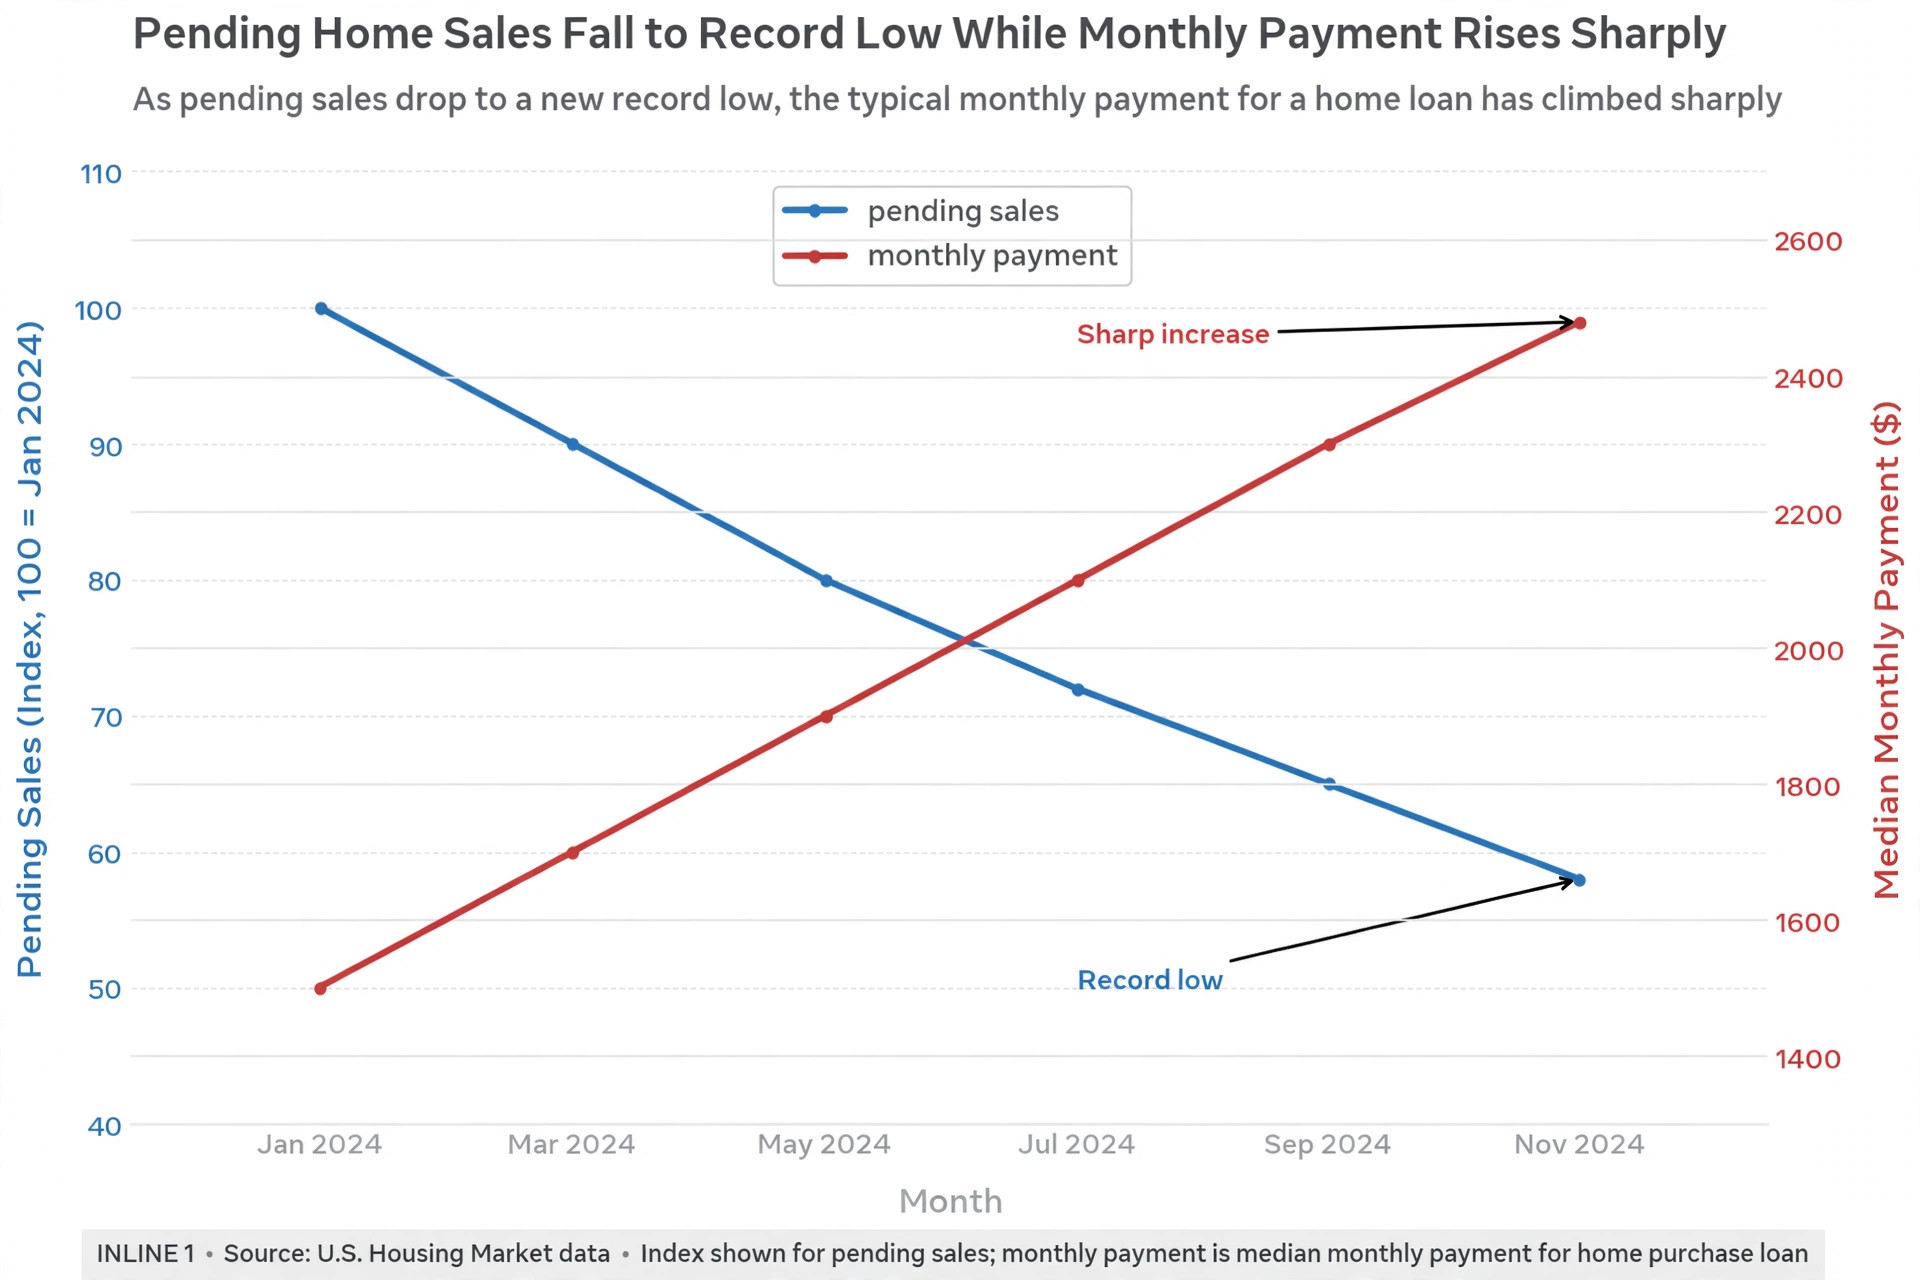
Contracts to buy U.S. homes just hit their lowest point in Redfin's records. Pending home sales fell 1.9% in a single week and are now down 14.4% from a year ago, according to the brokerage's weekly housing-market report released Thursday, October 22.
The report covers the four weeks ending Sunday, October 18. On a seasonally adjusted basis, only 281,749 homes went under contract, the weakest reading since Redfin's weekly data series began in 2021.
The verdict from Redfin is blunt: "Would-be homebuyers are pulling back as mortgage rates remain in the mid-7% range." With borrowing costs stuck near their highs, the fall market is grinding to a near standstill.
A record low, everywhere at once
This is not a regional story. For the second week in a row, pending sales declined in all 50 of the most populous U.S. metro areas. Every major market moved in the same direction, a breadth of weakness Redfin rarely sees.
The declines were steepest in the West and in fast-growing Sun Belt markets. Seattle led the drop with pending sales down 28.8% year over year. San Diego followed at negative 25.4%, then Atlanta at negative 23.8%, Denver at negative 21%, and Las Vegas at negative 20.6%.
One important note for readers following both datasets: this Redfin weekly series is a different measure from the National Association of Realtors' Pending Home Sales Index, which tracks a separate index and was covered in its own story (nar-pending-home-sales-september-plunge-october-2026.html). The two series are not interchangeable, so compare them carefully rather than mixing the numbers.
Rates are doing the damage
The cause is no mystery. The median monthly mortgage payment hit $2,796 at a 7.4% mortgage rate, the second-highest level in Redfin's records. It is up 10.4% from a year earlier, and that 7.4% rate matches the level Freddie Mac's benchmark has been holding near this month (freddie-mac-7-40-percent-rate-hold-october-2026.html).
That payment leaves little room for negotiation with math. More buyers are simply staying on the sidelines, a dynamic our broader coverage of rates near 7.4% has tracked all month (us-mortgage-rates-7-4-percent-october-2026.html). Every tenth of a point keeps another slice of would-be buyers priced out.
Sellers are cutting, and inventory is quietly building
Sellers are reading the room. New listings fell 1.4% week over week to a seasonally adjusted 354,412, the lowest level since July and the biggest weekly decline in three months. New listings are also down 2.7% from a year ago, as would-be sellers decide to wait out the rate freeze rather than list into a thin market.
Yet total inventory is still inching higher. Active listings rose 0.1% week over week to 1,507,161, or about 1.51 million homes, up 2.1% year over year. The reason is arithmetic: homes keep piling up because buyers are not depleting the pool quickly, as Redfin puts it.
That imbalance is starting to bite on price. The share of listings with price reductions climbed to 21.7%, up from 21% a year earlier. And while the median home-sale price did rise 0.2% year over year to $390,614, that follows two weeks of 0.1% increases, which Redfin characterizes as "a sign that prices are losing steam."
The rest of the report's table tells the same story of a cooling market. Median asking price stood at $399,629, up 0.9% year over year. Months of supply reached 4.4, up from 4, edging into the 4 to 5 month range considered balanced. Homes took a median of 50 days to sell, one day longer than a year ago, and just 28.3% went off market within two weeks, down from 29%.

What this means for buyers and sellers
For buyers, patience is paying off. Redfin says there are hundreds of thousands more home sellers than buyers across the country, and it frames the moment this way: buyers have "the most negotiating power they've had in over a decade." That is Redfin's characterization, but the numbers behind it are real, with price cuts rising and sellers outnumbering buyers by a margin we have not seen since 2013 (us-seller-surplus-widest-since-2013-october-2026.html).
If you can afford the monthly payment at current rates, this is one of the friendliest buying environments of the past decade. Ask for credits, negotiate repairs, and do not assume the list price is the final word.
For sellers, the message is equally clear: price to the market you have, not the market you remember. A $399,629 median asking price against a $390,614 median sale price, with average sale-to-list ratios at 98.4%, means overpricing is punished. Listing fresh and competitive beats listing high and chasing the market down with reductions.
For everyone else, the math of waiting still favors renters in many markets. With ownership costs near records and home prices losing steam, running the numbers on renting versus buying is worth the hour it takes (rent-vs-buy-2026-renting-cheaper-than-owning.html).
Frequently Asked Questions
What did Redfin's October report actually show?
Redfin reported that pending home sales fell 1.9% week over week to the lowest level in its weekly records, which date back to 2021. On a seasonally adjusted basis, 281,749 homes went under contract in the four weeks ending October 18, down 14.4% from a year earlier.
Is this the same as the NAR Pending Home Sales Index?
No. Redfin's weekly pending-sales series is a different measure from the National Association of Realtors' Pending Home Sales Index, which tracks contracts through a separate index with its own methodology and history. Our coverage of the NAR September reading is a separate story, and the two should not be mixed or compared directly.
Why are pending sales falling?
High mortgage rates are the main cause. The median monthly payment hit $2,796 at a 7.4% rate, the second-highest level on record and up 10.4% from a year ago. Redfin's own summary: "Would-be homebuyers are pulling back as mortgage rates remain in the mid-7% range."
Which metro areas saw the biggest drops?
Seattle saw the steepest year-over-year decline in pending sales at negative 28.8%. San Diego was next at negative 25.4%, followed by Atlanta at negative 23.8%, Denver at negative 21%, and Las Vegas at negative 20.6%. Declines hit all 50 of the most populous metros for the second consecutive week.
Are home prices falling now?
Not yet, but growth has nearly stopped. The median sale price rose just 0.2% year over year to $390,614, after two weeks of 0.1% increases. Redfin characterizes that pattern as "a sign that prices are losing steam," and the rising share of price reductions, now 21.7% of listings, points in the same direction.
What should buyers and sellers do in this market?
Buyers who can handle current payments should lean into the leverage: request credits, negotiate hard, and compare renting versus buying before committing. Sellers should price competitively from day one, since the market punishes overpricing with longer days on market and eventual reductions.
How long does Redfin's weekly data go back?
Redfin's weekly housing-market data goes back through 2021 and covers more than 900 U.S. metro areas. The figures are subject to revision, so treat the latest week as the freshest estimate rather than the final word.