US Mortgage Rates Hit 7.4%, Highest Since November 2023: What It Means for Buyers
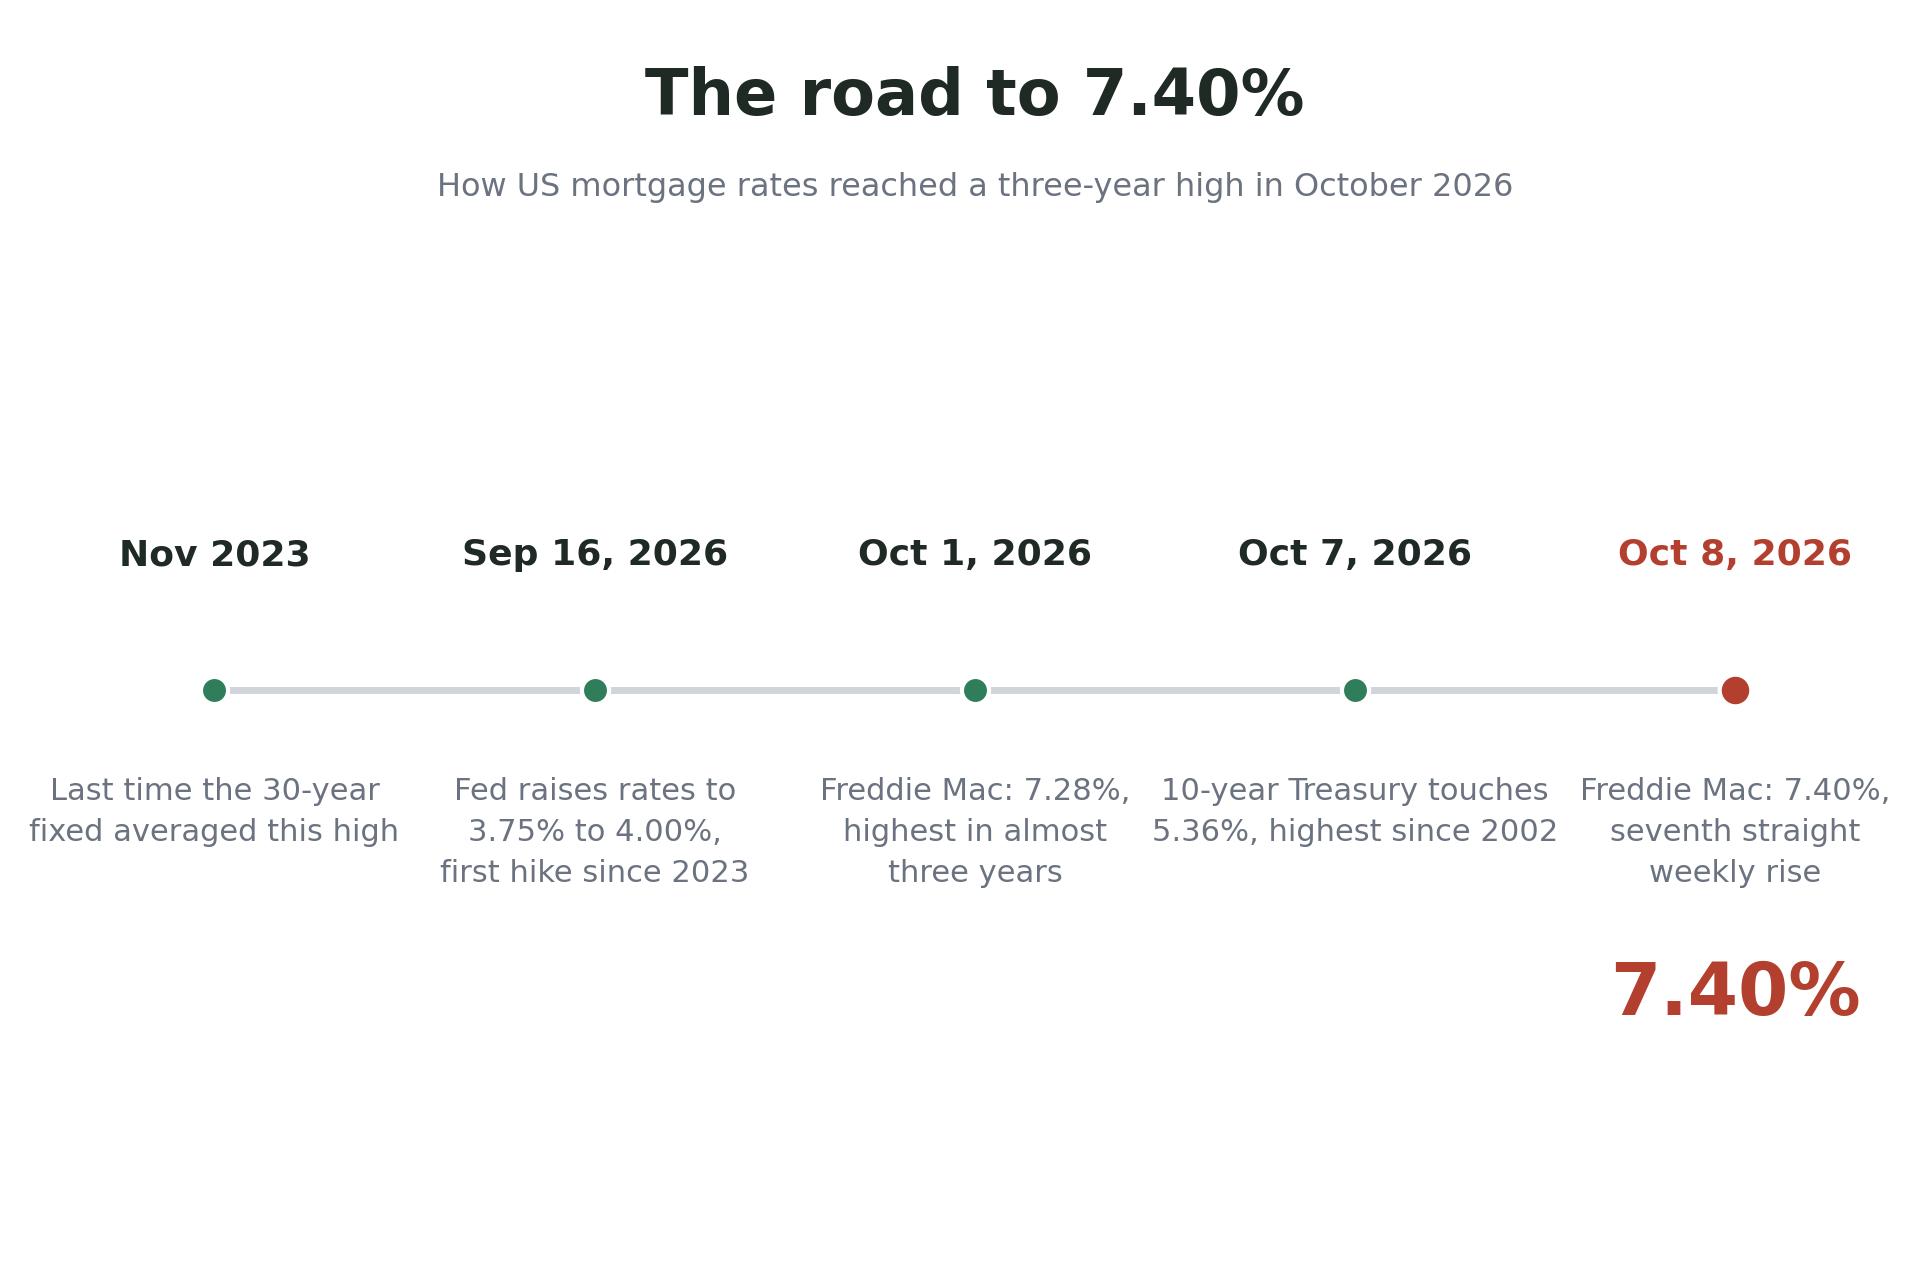
The average rate on a 30-year fixed mortgage climbed to 7.40% in the week ending October 8, 2026, the highest reading since November 2023, according to Freddie Mac's weekly survey. It was the seventh straight weekly increase, extending a run that has added roughly three quarters of a percentage point to borrowing costs in under two months. A separate survey from the Mortgage Bankers Association put the average contract rate even higher, at 7.49%, its highest in almost three years. Buyers are pulling back, sellers are cutting prices, and refinancing has nearly ground to a halt.
Where rates stand now
Freddie Mac's Primary Mortgage Market Survey, published October 8, reported the 30-year fixed-rate mortgage averaged 7.40%, up from 7.28% the prior week and well above the 6.30% recorded a year earlier. The 15-year fixed averaged 6.73%, up from 6.60% a week before and 5.53% a year ago. The survey covers conventional, conforming, fully amortizing purchase loans for borrowers with 20% down and excellent credit.
The Mortgage Bankers Association's own weekly survey, for the week ending October 2, told a starker story: its average contract rate for 30-year fixed loans reached 7.49%. MBA deputy chief economist Joel Kan said rates had moved to their highest level in almost three years as Treasury yields climbed and lending spreads widened. The two surveys use different loan samples and pricing windows, so the small gap between 7.40% and 7.49% is normal, not a contradiction.
Freddie Mac chief economist Sam Khater advised borrowers to shop around: "As market conditions continue to evolve, borrowers should remember that shopping around for a mortgage rate and getting multiple quotes can potentially save them thousands over the loan's lifetime."
Why they keep rising
Mortgage rates follow the 10-year Treasury yield more closely than they follow the Federal Reserve's policy rate, and the bond market has been on a historic run. The 10-year yield touched 5.36% on October 7, its highest since 2002, and closed October 5 at 5.31%, the highest daily close since May 2002. The 30-year Treasury yield reached about 5.73%, also its highest since 2002.
Several forces are pushing yields up at once. Inflation has stayed persistent: the Institute for Supply Management's services prices index hit 74.0 in September, its highest since July 2022. Oil moved above $100 a barrel as the war involving Iran widened, adding energy-driven price pressure. The federal government keeps borrowing heavily, with the fiscal 2026 budget deficit reaching about $1.993 trillion, and corporate borrowing for AI infrastructure (roughly $489 billion in new debt) is competing for the same pool of bond buyers. More bond supply means higher yields to attract investors.
The Federal Reserve has also resumed raising rates. On September 16 it lifted its target range to 3.75% to 4.00%, its first hike since July 2023. And Kan noted that mortgage spreads themselves have widened as rate volatility increased, which pushes the mortgage rate up even relative to Treasury yields.
What it costs buyers
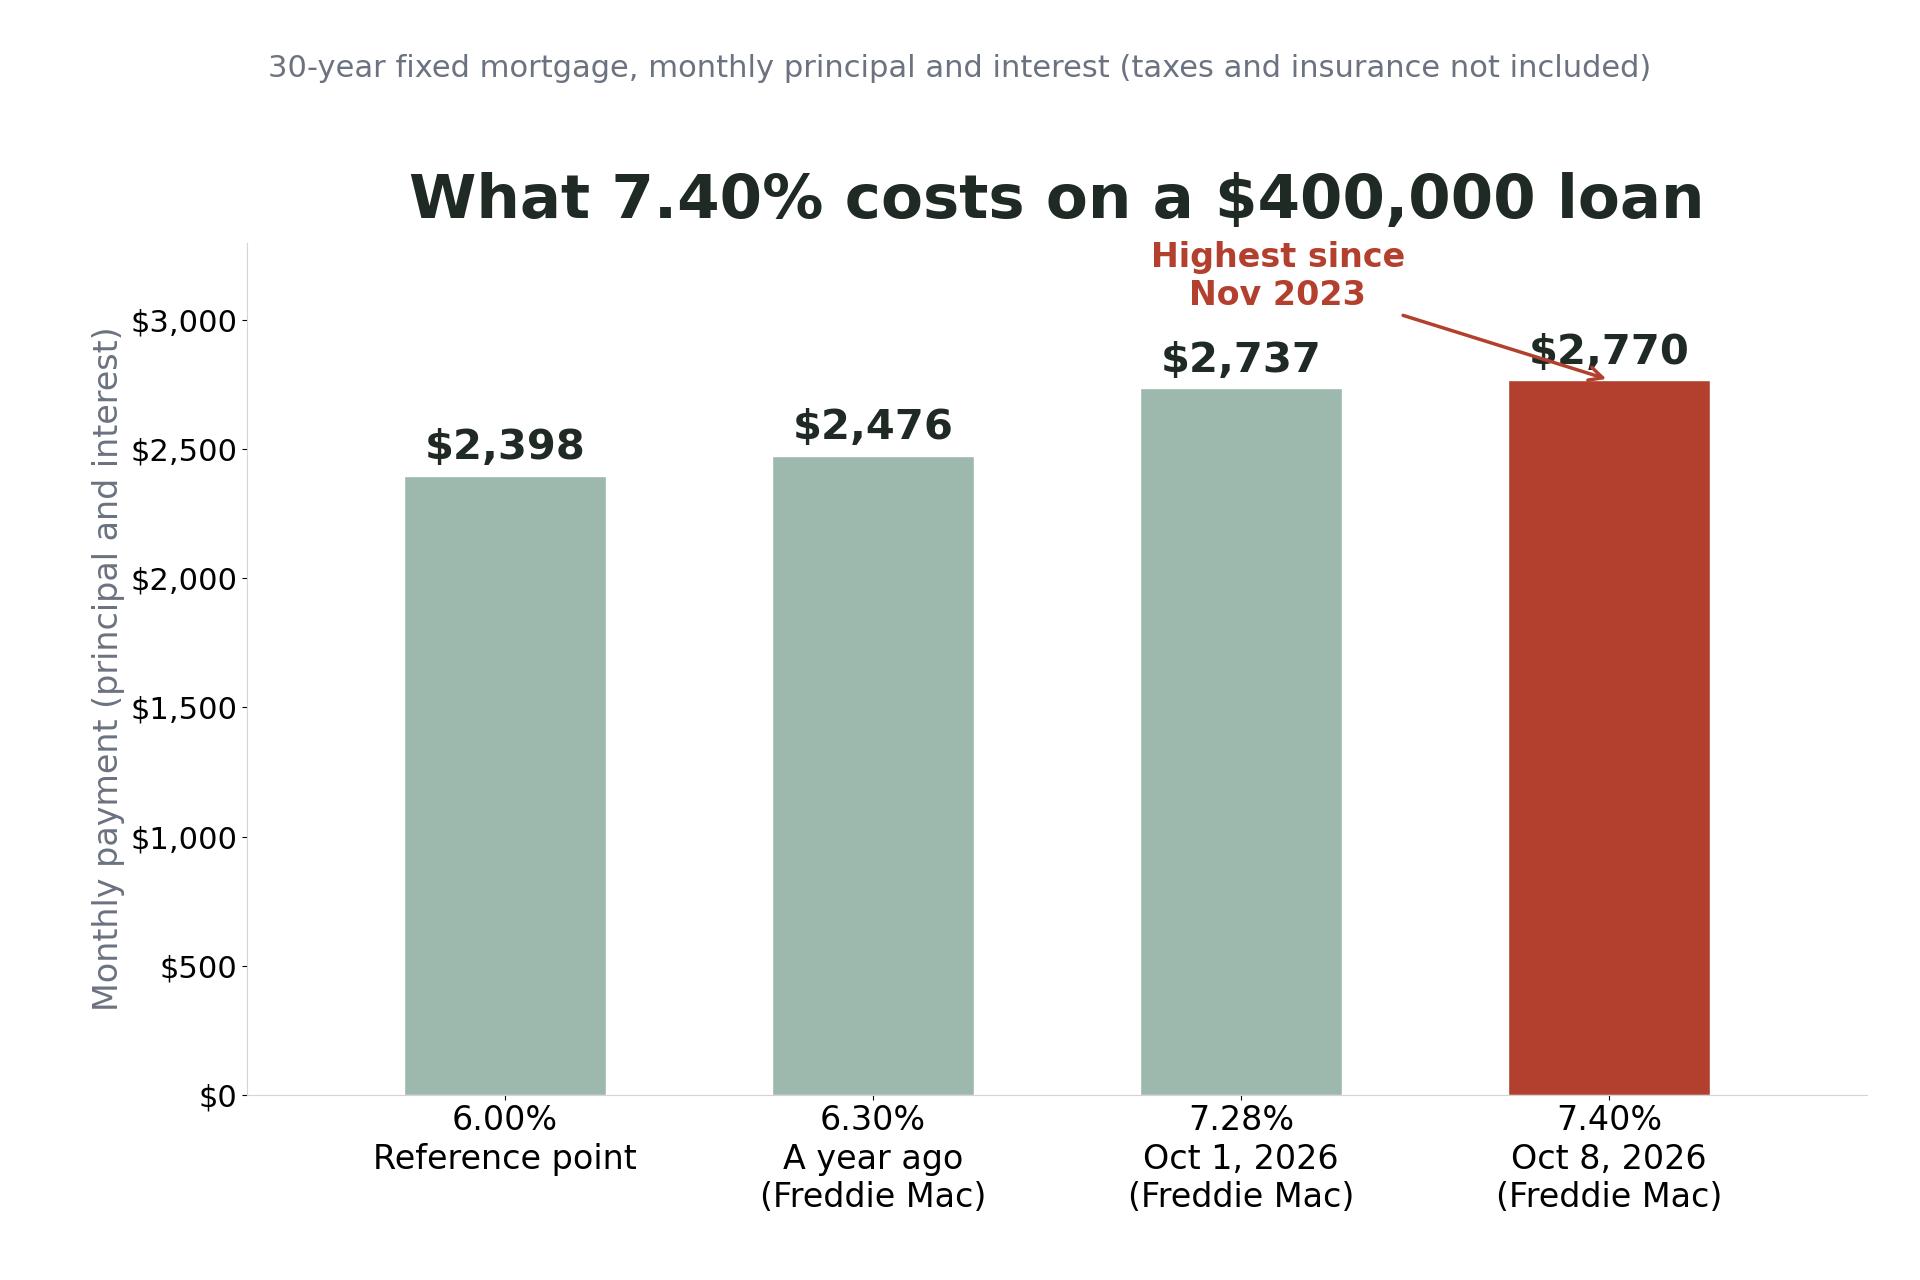
The math is unforgiving. On a $400,000 loan, monthly principal and interest at 7.40% comes to about $2,770. At 6%, the same loan costs about $2,398 a month. That is roughly $371 extra every month, or about $4,456 a year, for the identical house. Compared with a year ago, when Freddie Mac's average was 6.30% (about $2,476 a month on $400,000), today's buyer pays roughly $294 more per month.
The speed of the move matters too. The roughly 0.75 percentage point climb over the past seven weeks has added about $200 a month to the payment on a $400,000 loan, according to Barron's analysis. Even the single week from 7.28% to 7.40% added about $33 a month.
Realtor.com's September data shows how fast affordability is eroding. As rates swung from 6.66% in late August to 7.03% by September 24, a swing more typical of a three to six month period, roughly $11,500 in buying power was mechanically knocked off the budget of a fixed-budget home shopper. "September's housing data shows that buyers are gaining leverage, but higher mortgage rates are limiting how much of that opportunity they can use," said Realtor.com chief economist Danielle Hale.
Who is hit hardest, and who benefits
First-time and lower-income buyers are taking the worst of it. MBA data shows FHA purchase applications fell 6% in a single week, the steepest drop of any loan type, and Kan said higher rates are adding to ongoing affordability challenges for these buyers. Purchase applications overall fell 2% on the week and sit 15% below a year ago.
Homeowners hoping to refinance are essentially locked out. Refinance applications fell 8% on the week and 56% from a year earlier, hitting their lowest level since 2025. Kan said very few homeowners have any incentive to refinance at these rates, with applications running at less than half of last year's pace. The refinance share of all mortgage activity slipped to 37.0%.
Homebuilders are feeling it in the stock market: the iShares U.S. Home Construction ETF is down 10.8% since the end of August, its worst stretch since the period ended October 6, 2023, according to Dow Jones Market Data.
Borrowers are adapting where they can. The share of applications for adjustable-rate mortgages held steady at 10.3%, up from just over 2% in early 2021, as buyers trade rate certainty for lower initial payments. And there is a genuine silver lining for buyers who can still transact: leverage is shifting their way. Realtor.com found 20.8% of active listings had a price cut in September, the highest share for any September since 2018 and the highest single-month reading since October 2022, nearly a four-year high. Active inventory grew 5.4% year over year to more than 1.16 million homes, while the median listing price slipped 1.4% from a year earlier to $419,250.
Pending sales confirm the slowdown. The National Association of Realtors reported its Pending Home Sales Index at 71.2 in August, up 0.3% on the month but down 4.7% from a year earlier, with all four regions declining. "Nationally, contract signings today are running roughly 30% below where they were in the years leading up to the pandemic," said NAR chief economist Lawrence Yun. Realtor.com's September data showed the stock of listings in pending status down 4.1% year over year, a second straight monthly decline.
Cash buyers and well-prepared financed buyers are the relative winners. Hale noted that buyers who can navigate today's financing costs will find more choices, less competition, and greater room to negotiate. This pattern is not unique to the United States: Australia is going through its own rate-driven housing correction, which we covered in Australia's Housing Bubble: What Actually Happened.
What could bring relief
Forecasters see modest relief ahead, not a rescue. A TD Cowen research team expects mortgage rates to ease to about 6.8% by the end of 2026 and 6.6% by the end of 2027. "The housing market remains stuck in a holding pattern, with high rates and poor affordability limiting both supply and demand," the team wrote. They cautioned that with most existing mortgages not refinancable at current levels, slightly lower rates alone would not restart the market.
The Federal Reserve meets October 27 to 28, with its decision announced October 28 at 2:00 PM ET. Markets currently lean toward a hold after soft jobs data, though traders still see a strong chance of another hike by December. September inflation data, due mid-October, could shift those odds quickly. For mortgage rates to fall meaningfully, the bond market would need to see cooling inflation, calmer energy prices, or easing pressure from government borrowing. None of those is guaranteed. Australia's central bank faces a similar set of pressures ahead of its own November 3 decision.
Frequently Asked Questions
What is the current 30-year mortgage rate?
Freddie Mac's weekly survey put the 30-year fixed average at 7.40% for the week ending October 8, 2026, the highest since November 2023. The Mortgage Bankers Association's survey for the week ending October 2 reported an average contract rate of 7.49%. Both move weekly.
Why are mortgage rates so high right now?
Mortgage rates track the 10-year Treasury yield, which touched 5.36% in early October, its highest since 2002. Yields are being pushed up by persistent inflation, oil above $100 a barrel amid the war involving Iran, heavy federal borrowing, corporate debt issuance for AI infrastructure, and the Federal Reserve's resumed rate hikes.
Will mortgage rates go down before the end of 2026?
TD Cowen expects rates around 6.8% by year end and 6.6% by the end of 2027, which would be modest relief. No mainstream forecaster expects a return to the near-3% rates of 2021. Much depends on inflation data and the Fed's October 28 and December 9 decisions.
Should I buy a house now or wait for lower rates?
There is no universal answer. Waiting for lower rates means gambling that they fall, while buying now means accepting today's payment. The one clear buyer advantage right now is negotiating power: price cuts are at a near four-year high and inventory is up 5.4% from last year, so well-prepared buyers face less competition.
Why do Freddie Mac and the MBA report different rates?
They survey different things. Freddie Mac's survey covers conventional, conforming purchase loans for well-qualified borrowers with 20% down. The MBA tracks contract rates across a broader mix of actual loan applications, including different loan types and borrower profiles, over a different pricing window. Small gaps between them are normal.
How much more does 7.40% cost compared with 6%?
On a $400,000 30-year loan, principal and interest run about $2,770 a month at 7.40% versus about $2,398 at 6%, a difference of roughly $371 a month or about $4,456 a year. Taxes, insurance, and fees are not included in those figures.
This article summarizes published mortgage-rate data as of October 2026. Rates move daily; nothing here is financial advice.